Telephone
86-371-60170260

Name:HENAN GUANGDA TEXTILES IMP. & EXP. CO., LTD.
Add:10/F,XinMangGuo Building,No.9 Business Outer Ring Road,ZhengDong New District,ZhengZhou,China
Tel:86-371-60170260
Fax:0371-60136222
Postcode:450000
Web:www.hngdtex.com
With the rush of pre-tariff shipments fading away and new shipping capacity entering the market, the freight rates across the major routes have generally pulled back.
According to the data collected by the CCFGroup, the freight rates of major routes held stable in this period. The freight from Ningbo to Egypt/SOK was at US$6000/40HQ, that to Indonesia/Jakarta was at US$1400/40HQ, that to Pakistan/Karachi was around US$2600/40HQ, and that to Bangladesh/Chattogram was around U$2100/40HQ.
Remark: the freight of different ships and forwarders differs, and the above freight is only for reference.
The following is a brief summary of major routes performance:
Route | Description |
Europe | Transport demand remained relatively stable, and spot market booking rates have edged down after consecutive hikes. |
North America | Overall transport demand stayed steady with balanced supply and demand. Spot freight rates were undergoing adjustments recently following sharp rises in earlier stages. |
Middle East | Renewed geopolitical tensions have dampened market expectations over stable shipping passage through the straits. Coupled with persistent severe congestion at major transshipment ports, freight rates have halted their decline and rebounded. |
I. US route: Front-loading fever fades, rates pull back sharply
In early-July, US-bound routes saw one final strong rally of the season, but the upward momentum lasted only a few days before showing clear signs of softening.
*East coast routes: Spot rates fell approximately 10% week-over-week, as some cargoes could no longer arrive before the 10% interim tariff window (calculated by port arrival date), reducing the urgency for front-loading.
*West coast routes: The blended ratio of long-term contract rates to spot rates dropped by as much as 37%. Some shippers, believing rates had peaked, chose to delay shipments, leading to lower-than-expected slot utilisation on certain vessels and putting downward pressure on market pricing.
*Capacity supply: Effective capacity from Asia to the US is projected to grow 7.5% month-over-month in July to approximately 2.13 million TEU, with August planned capacity rising another 6.5% to 2.27 million TEU. New service launches and extra-loader vessels have steadily eased the supply-demand tightness.
As JOC quoted market participants, after four consecutive months of gains, spot rates on the US West Coast have now entered a correction phase. In the near term, rate movements will depend on cargo volume recovery, capacity deployment pace, and further developments in US trade policy.
II. Europe: weaker demand meets Rhine low-water crisis, costs and transit times deteriorate
The European trades presented a contrasting picture of "soft demand and rising costs".
*Freight rates: according to the latest data from the SCFI, Shanghai–North Europe base port rates moved down 2.5% week-over-week, while the Mediterranean route dropped 3.3%. With many European importers entering the summer holiday period in July and earlier pre-stocking demand largely exhausted, fresh cargo volumes have been insufficient to sustain rate levels.
*Rhine River water level crisis: As of 13 July, the crucial Kaub gauge in Germany dropped to a critical 53 cm, a 57 cm plunge from 110 cm just one week earlier, with official forecasts predicting further declines in the coming days.
Quantified knock-on effects:
Kaub Water Level | Maersk low-water surcharge (40ft) | Inland logistics cost increase | Average barge waiting time |
53 cm (current) | EURO455/FEU | +50%–150% | 80 hours |
≤51 cm (warning) | EURO 645/FEU | Further escalating | Further worsening |
≤41 cm (extreme) | EURO 795/FEU | Critical strain | Near-stagnant port evacuation |
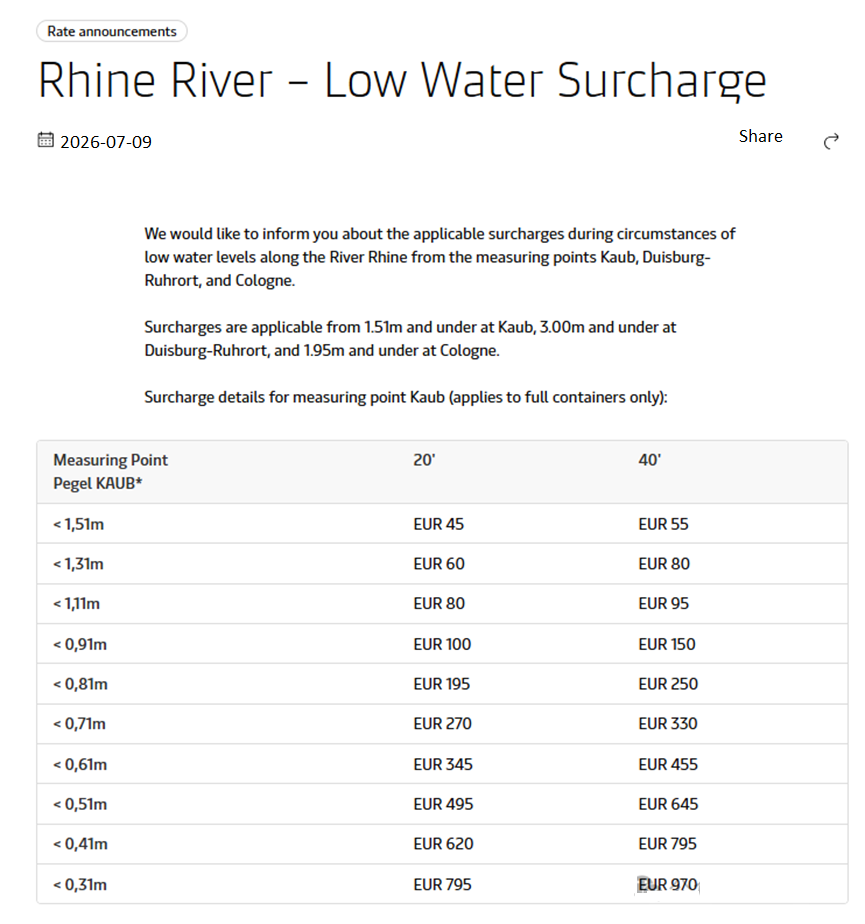
Lower water levels force barges to reduce loading, multiply voyage frequencies, and significantly raise inland freight costs. More critically, they clog the discharge channels from major seaports such as Rotterdam and Antwerp, leaving ocean-borne containers stranded at terminals instead of being distributed to inland destinations in Germany, Switzerland and Austria.
III. Two core wildcards: Hormuz Strait and Red Sea resumption game
The market has moved past the peak of the "artificially advanced peak season" and is entering a seasonal adjustment phase. However, the biggest uncertainties ahead are not supply-demand fundamentals but geopolitical factors.
(A) Closure of the Strait of Hormuz
On the early morning of 12 July, Iran's Islamic Revolutionary Guard Corps Navy announced the temporary closure of the Strait of Hormuz, citing "illegal foreign interference" and stating that warning shots had been fired at a vessel that deviated from approved routes. The strait handles approximately one-third of global seaborne oil trade and a substantial volume of container transits. If the conflict escalate, market attention will swiftly shift from "rate corrections" to "war-risk premiums", encompassing oil prices, insurance surcharges, vessel operating costs, and broader market sentiment.
(B) Divergent signals on Red Sea re-routing
*Maersk & Hapag-Lloyd: On 6 July, the two carriers announced that the AE15 service under their Gemini Cooperation would resume transit via the Suez Canal and Red Sea, no longer routing around the Cape of Good Hope. The first vessel to take this route is the Majestic Maersk (~19,000 TEU).
*CMA CGM: CEO Rodolphe Saadérevealed that approximately 60% of the group's fleet has already resumed Suez transits, while the remaining 40% still sail via the Cape, emphasising that "safety takes precedence over efficiency".
While the two major alliances' early resumption puts competitive pressure on other carriers, Red Sea security risks have not been eliminated. Over the coming weeks, the industry will closely monitor whether the resumption ratio expands further, or whether it contracts again due to tensions in the Hormuz region.
IV. Secondary factors: Congestion and Canal draft restrictions
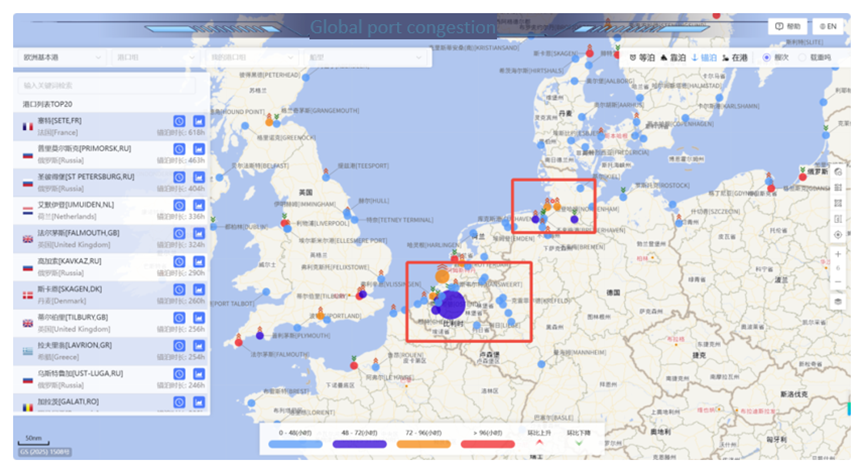
*Global port congestion: Linerlytica data showed that approximately 11% of the global container fleet, about 3.72 million TEU, was currently waiting at anchor, marking the most severe congestion level since 2022. This has tightened chassis availability, extended pick-up waiting times, and increased detention, demurrage, and missed warehouse appointment risks.
*Panama Canal draft limits: On 1 July, the ACP further tightened draft restrictions for Neo-Panamax vessels as a precaution against potential low-water conditions due to El Niño. For 13,000–15,000 TEU-class vessels, every 0.5-foot reduction in draft typically reduces capacity by 500–800 TEU. While not a dominant variable, this adds marginal supply-side constraints on the Asia–US East Coast routing.
V. Capacity rankings: UniFeeder exits, CMA CGM leads growth for second month
According to the data from Alphaliner, as of 10 July, the global operating container fleet stood at 7,592 vessels (+45 month-over-month), with total capacity of 34,427,972 TEU (+185,227 TEU).
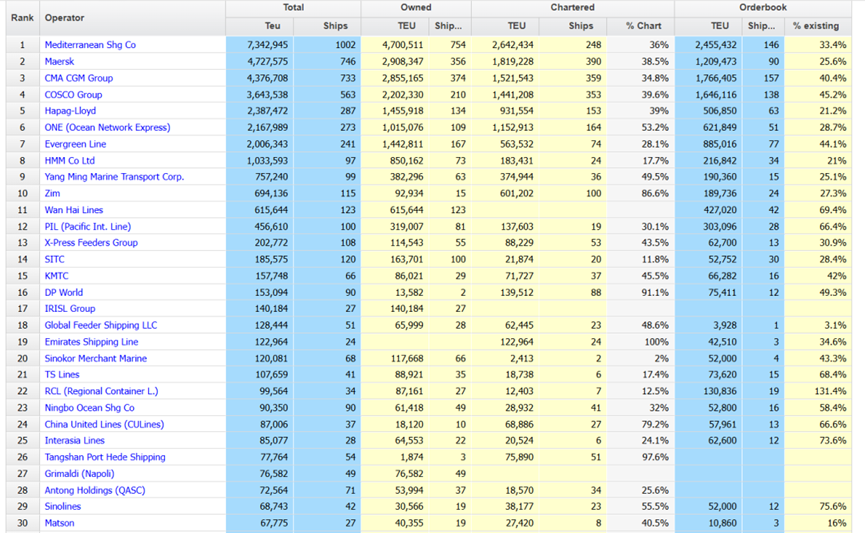
*Ranking changes: UniFeeder officially exited the top 20 following its integration into the DP World brand. Emirates Shipping Line and Sinokor Merchant Marine swapped positions to rank 19th and 20th, respectively.
*Top capacity additions: CMA CGM (+43,787 TEU, +1 vessel), COSCO (+32,953 TEU, +5 vessels), and Maersk (+32,492 TEU, +4 vessels) led the month's growth.
Summary
July presents a distinctly "bullish-bearish interplay" in global shipping. Bearish forces: US front-loading demand fading, European summer lull, Rhine low-water disruptions raising inland costs. Bullish forces: War-risk premium from Hormuz closure, fragile Red Sea recovery, Panama Canal draft curbs, and congestion effectively absorbing a portion of global capacity. Over the next 4–8 weeks, the market may oscillate between "seasonal demand softening" and "rising geopolitical risks". The evolution of the Hormuz situation stands out as the single most consequential asymmetric variable determining the direction of freight rates in the second half of the year.

Telephone
86-371-60170260
HENAN GUANGDA TEXTILES IMP. & EXP. CO., LTD.
Tel:86-371-60170260
Fax:0371-60136222